3D Key Performance Indicator
The CompuGroup Medical SE & Co. KGaA is one of the leading international providers of software for the healthcare industry. In cooperation with THIS GmbH and redPlant Realtime Studios, various interactive 3D visualizations for the communication of the most important company key figures, also called Key-Performance Indicators, were created. The application seamlessly integrates with CGM's systems and receives all important parameters for the three-dimensional visualization via a dedicated interface.
Key Performance Indicator
The term Key Performance Indicator (KPI) is used to describe key figures with which the performance and activity of a company can be measured or determined. In order to be able to present these in a clear and varied way, various types of diagrams have been created, which are not only visualized purely three-dimensionally, but even using particle clouds.

Particel clouds, ...
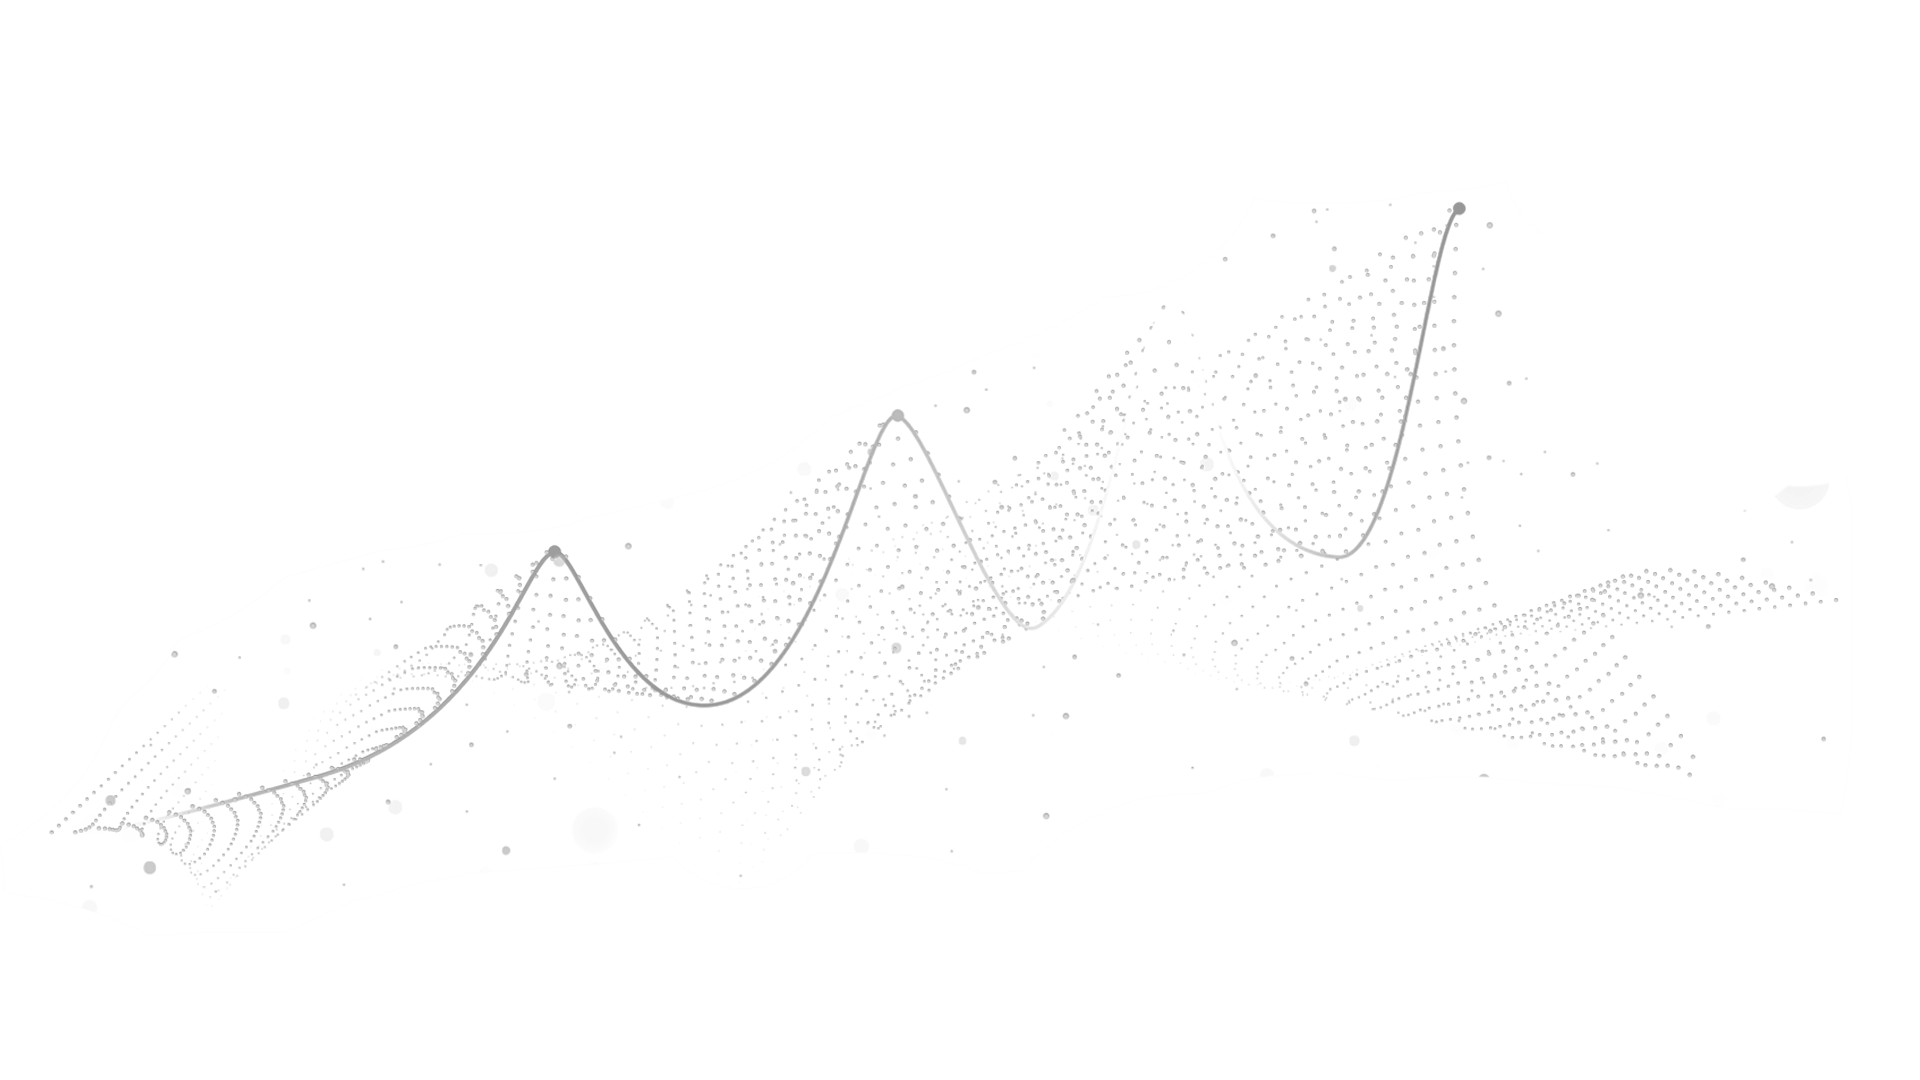
The three-dimensional diagrams each consist of over 3000 individual particles. Within this defined diagram shape, the particles are in permanent motion. Edge Highlighting provides clear and recognizable contours of the shape by making the agglomeration of particles at the edges larger than in the center of the shape. A smoother transition to the background is provided by Dust Particles – individual particles that are arranged floating freely around the shape.
... that follow you
In addition to the classic 3D interaction, the integration of flocking created another interaction option for the user to playfully engage with the various diagrams. The particles from a defined environment follow the movement of the mouse cursor or touch point and cluster at this point.
Interactive 3D for the brain
Visual associations help our brain to understand facts faster and thus to learn them in a shorter time and to internalize them in the long term. The three-dimensional illustration of the diagrams and the immediate interaction by the user takes this to the next level. The user can thus engage with the form and its message in an informal and playful way.

Pyramid
Pyramids are not only grandiose structures, but are also frequently used as a diagram form, especially in the fields of marketing, management and education. Through them, important steps within a process or even the structure of an organization can be visualized vividly. In the visualization, the sections of the pyramid were slightly separated from each other and marked via a label with the percentage and the corresponding aspect.

Bar chart
This chart type is particularly well suited for comparing values within a category and for visualizing developments. The challenge here is to position the labels clearly visible at all times, no matter what values the individual bars assume. Thus, not only the height of the individual bars, but also the height and width of the entire diagram and the distances between the bars are dynamically calculated and visualized based on the specified values.

Metaball
Metaballs are used to compare and contrast several factors. In most cases, two are sufficient. Since 3D metaballs cannot simply be created using a primitive geometry, but are generated by a complex marching cubes algorithm, the visualization can also present more than two factors. Another challenge was to find the perfect balance between performance and visuality, since the curves require more particles than the other diagram types.
Responsive Design
Whether on a large touchscreen during a company presentation, as employee information via the PC or for the customer to go on the smartphone, the KPIs are available on every common device and can be explored both by touch and with the mouse. In the process, the diagrams and font sizes adapt to the respective output and thus ensure that all information is always displayed well.
Interface
The three-dimensional forms are filled with life via a dedicated interface. In addition to the actual key figures, further information in the form of headings, texts and labels can be edited via the in-house CMS and, thanks to the interface, transferred directly to the respective KPI visualization. The information is directly incorporated into the calculation and visualization of the charts in real time and displayed immediately.
KPI to go
An export function has been integrated so that the KPI visualizations can also be used in various presentations and print campaigns. This function creates a composition from the snapshot of the respective diagram and a predefined CGM template in which the graphic is automatically placed. Thanks to the interface, the additional content of the composition, the selection of the desired template as well as the download of the final image file can easily be done via the content management system.
Features
WEBGL
The configurator was implemented in WebGL and is available in all common browsers without plugins.
Performance
To save drawcalls, the particles are instantiated. Additionally, barycentric coordinates are used.
Partikel
Complex algorithms enable dynamic particles that respond to mouse interactions.
Line- & Text-Rendering
The labels are generated and displayed directly in the 3D scene using optimized line & text rendering.